How to use Data Trace in CX-Drive
Introduction
Often it is useful to get a more detailed picture of the status of our drives when troubleshooting. A useful tool for this is CX-Drive which is normally used for setting the parameters of the drive, but can also be used for creating a real time data trace of events on the drive. This article covers how to configure and read the data trace to assist with troubleshooting.
1. Connect to the drive
Info
For issues with connecting to the drive please see the below article.
https://store.omron.co.nz/knowledge-base/usb-device-driver-issues
Connect to the drive by clicking the “binoculars” icon on the top left

The software will search for connected devices. If it fails, click on the Settings button to modify the connection settings.
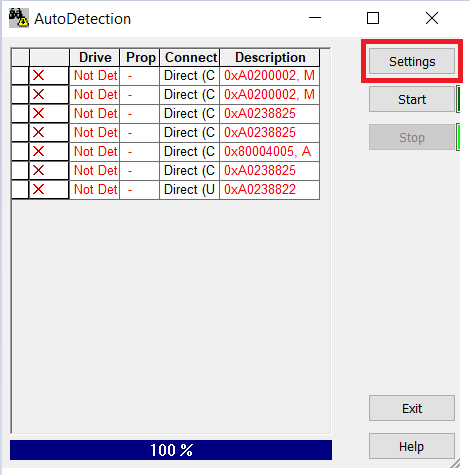
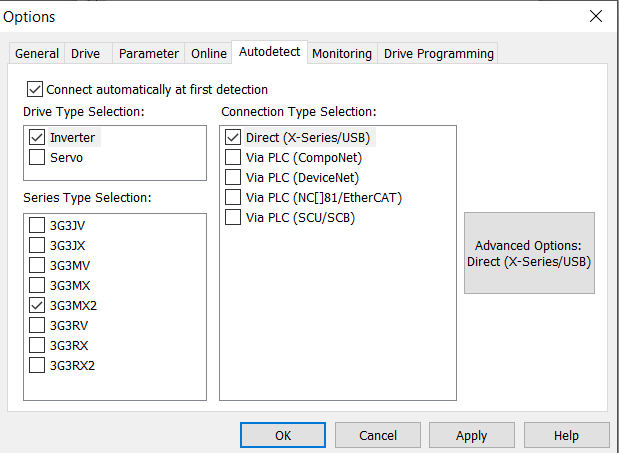
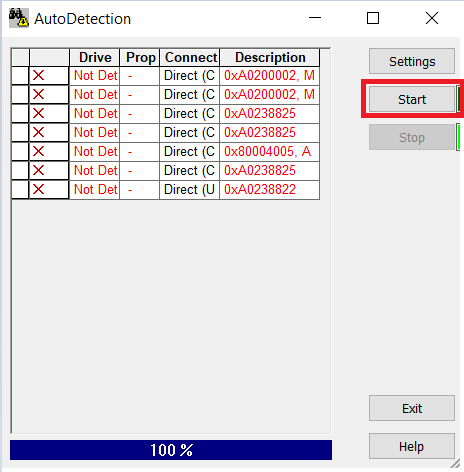
Ensure that the correct device type is selected. In the below example we are trying to connect to a 3G3MX2 drive. Click OK and then Start to connect to the drive
2. Configure and run the Real Time Trace
Navigate to the Real Time Trace section shown below:
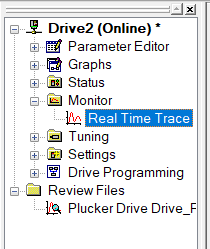
Select the parameters you wish to monitor. You can select up to 8 parameters at a time to monitor. Common parameter that are useful are:
- D001 Output frequency monitoring
- D002 Output current monitoring
- D006.1 Run
- D006.3 Alarm
- D102 DC Voltage monitoring
- D104 Electronic thermal overload
- D130 Analogue input FV
- D131 Analogue input FI
To mark the parameter to be monitor, tick the “Monitor” checkbox next to the parameter.

Once you are happy with the parameters you wish to monitor click the Start button.
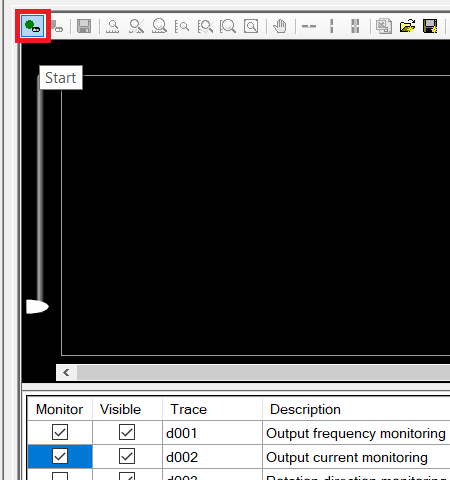
Run the trace for the period you would like to monitor. While the trace is running you will see the current values of the parameters plotted on the graph. Click the Stop button when you wish to stop recording.
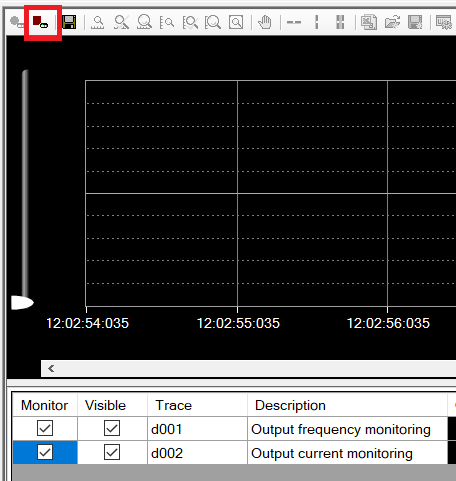
3. Analyze the Trace
You may toggle visibility of parameters by toggling the "Visibility" checkbox.

The trace can be panned with the scrollbar on the bottom.

You may see the values of the parameters at a given time step by enabling the vertical cursor and dragging it to the desired time.

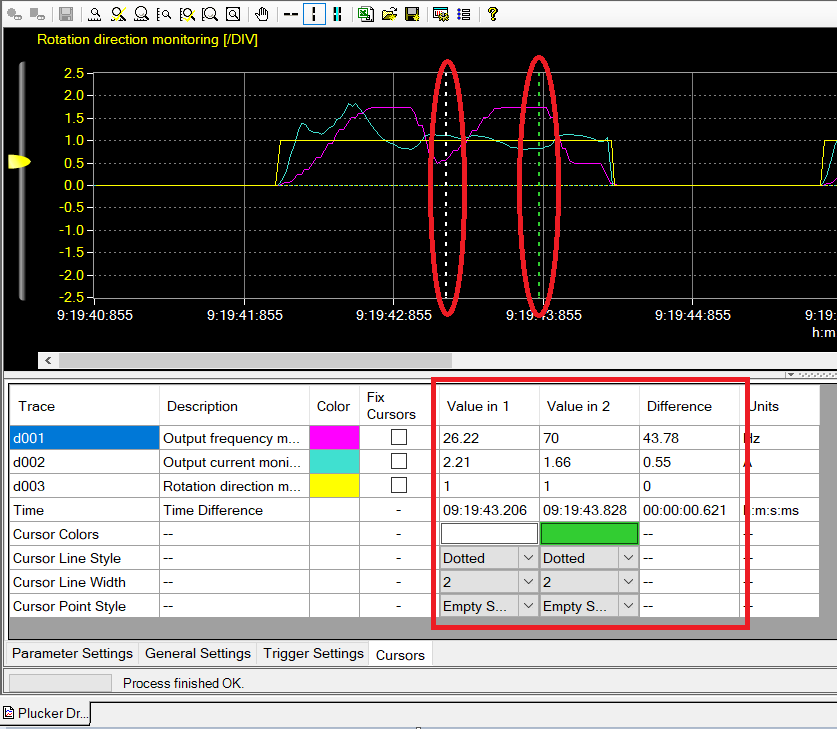
The graph may be zoomed to the desired level using the below tools.

4. Save the Trace
The trace may be saved to a file using the Save button.

The trace can also be exported to an excel spreadsheet with the Export to .csv button.
