Introduction
AMR Debug Logs provide all the necessary information required to troubleshoot AMR issues, from Wi-Fi drop-outs to path-planning. If there is an issue with an AMR it will (almost) always be required to supply the debug logs from all AMR's involved as well as the EM2100 if present.
Procedure
Step 1
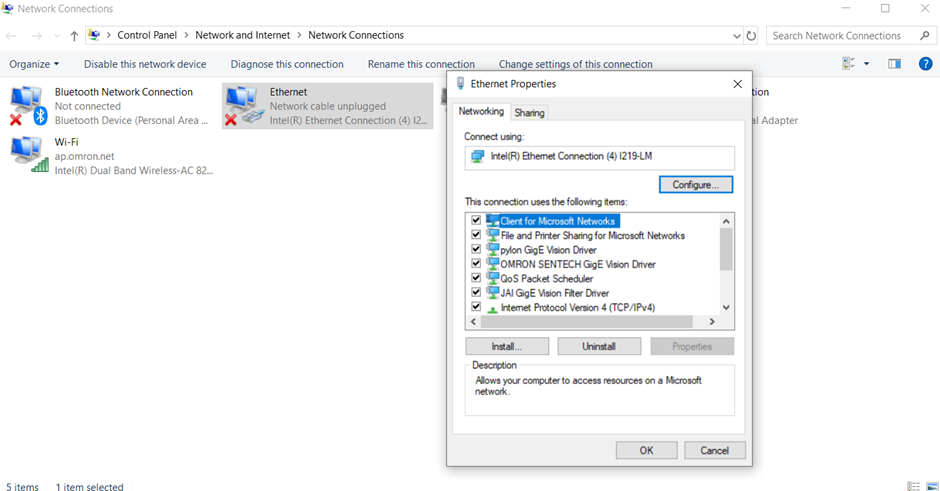
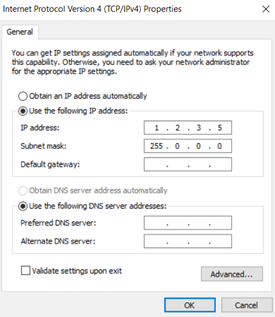
Change the Ethernet/IP address of your laptop to a fixed address of 1.2.3.5 (any address on the 1.2.3.X subnet will work except for 1.2.3.4 which is the address of the AMR/EM). To do this in windows, navigate to Settings>Ethernet>Change Adapter Options, Double-click on Ethernet and the below window will be displayed:
Double-click on Internet Protocol Version 4(TCP/IPv4) and enter the same IP address and subnet as shown below:
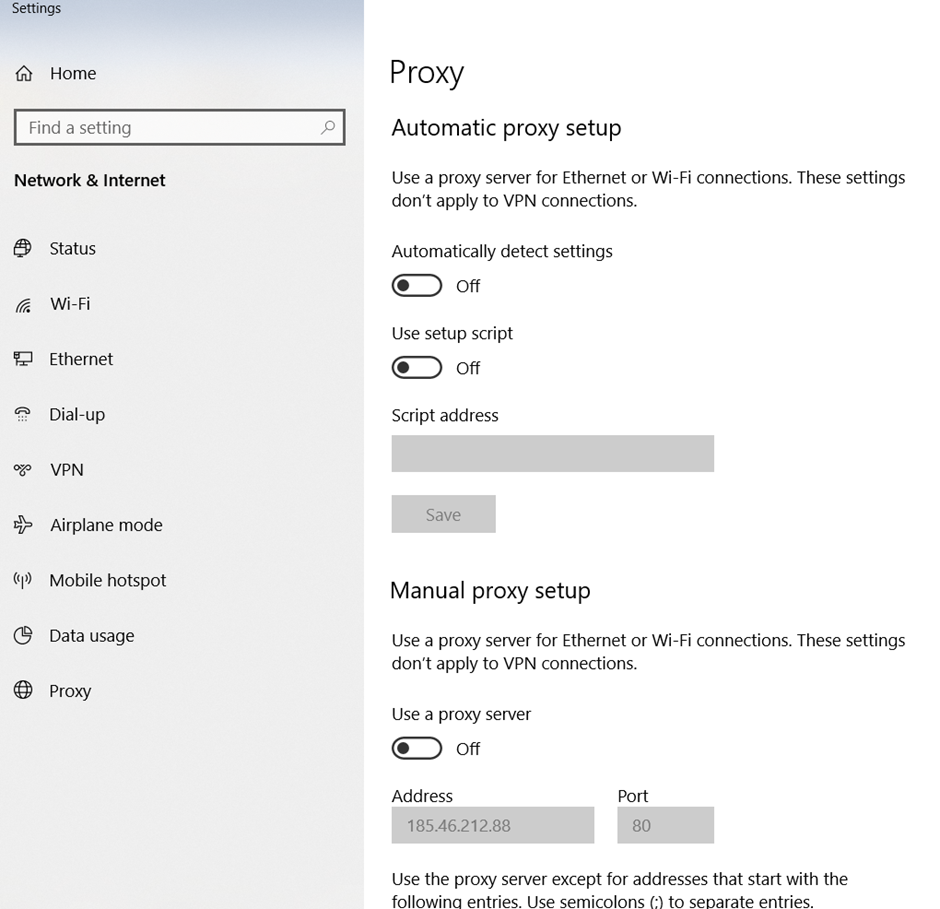
Navigate to proxy settings by typing "proxy" into the search bar and ensure Use a proxy server is turned off:
Step 2
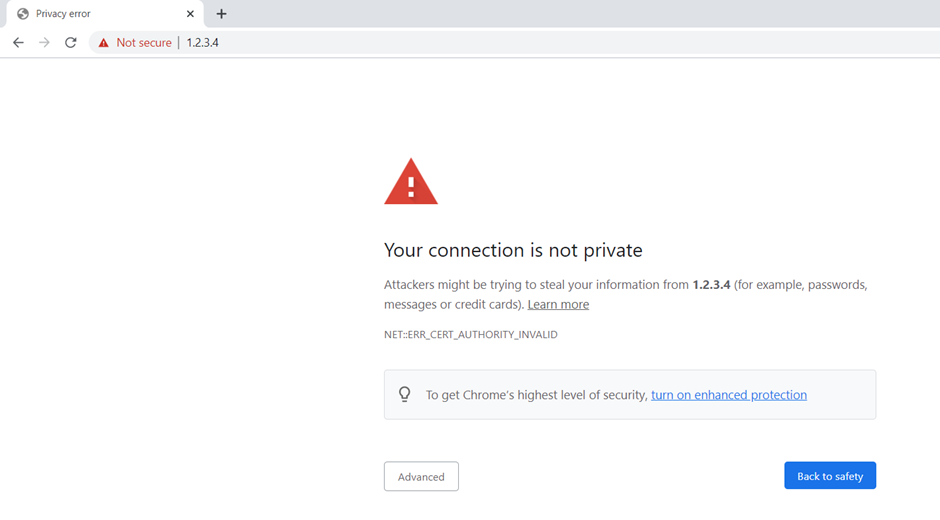
Connect Ethernet cable from laptop to AMR (or to the Maintenance for of the EM2100 for EM Debug Logs). Open a browser and type 1.2.3.4, the following screen should be displayed. Click Advanced and then Proceed to 1.2.3.4 (unsafe). In some instances, it will be necessary to disconnect from Wi-Fi in order to make this connection.
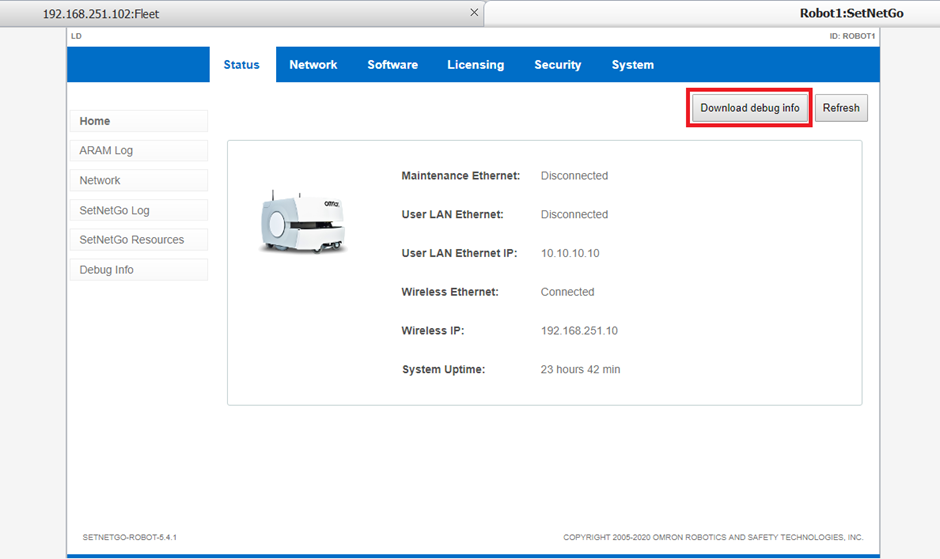
After click to proceed the following screen should be displayed.

Click on Download Debug Info and a .zip file will be downloaded. This is the Debug File that should be sent to your Omron Support Team.
Step 3 (Optional)
When operating a fleet of AMR's it is possible to obtain the AMR debug logs via the EM2100 Fleet Port. First, connect to MobilePlanner through the EM2100's fleet port and click the Fleet icon at the top of the screen to show all connect AMR's:
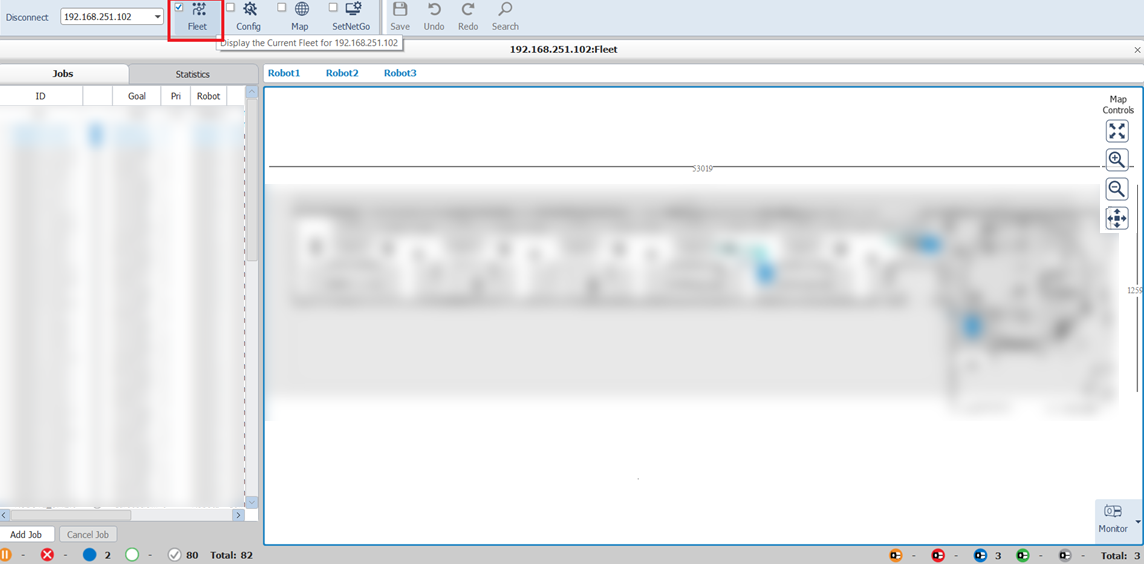
Right-click on the desired AMR and select SetNetGo. Enter the username and password.

The same screen as the previous step will be displayed and the Debug logs can be downloaded.
Please note: it is not possible to access the EM2100 Debug Logs through the Fleet port of the EM. To gather EM2100 Debug logs you must connect through the Maintenance port as in the previous steps.